A marketing head presents an SEO forecast to her finance director: “Organic traffic will grow 300% in 12 months.” The finance director asks three questions. Which assumptions produce that number? What happens if they are wrong? And when does the money actually arrive? The forecast has no answers, so the budget is cut to a trial. The problem was not the ambition. It was a forecast built for marketing, presented to finance.
The short answer: an SEO forecast that finance teams accept is built bottom up from your revenue keywords, not top down from traffic. Start from a seasonal baseline, estimate the extra clicks from realistic ranking gains using your own click through rates, apply a ramp curve for timing, convert clicks into revenue with your real conversion rates and deal values, and present three scenarios with every assumption written down. Add risk adjustments for core updates and AI Overviews, show payback against cost, and report forecast against actual every month.
This guide is part of our series on search coverage, the SEO metric that ties rankings to revenue. It walks through the full forecasting method with worked numbers, a short script and an assumptions log template. All figures in examples are illustrative.
What finance teams look for in an SEO forecast
| Finance question | What your forecast must show |
|---|---|
| Where does the number come from? | A bottom up model from named keywords, positions and conversion rates |
| How sure are you? | Conservative, expected and stretch scenarios, not one number |
| When does revenue arrive? | Month by month timing, including sales cycle lag |
| Is it incremental? | Growth above the baseline that would happen anyway |
| What does it cost and when does it pay back? | Monthly cost, contribution margin and payback month |
| What could go wrong? | Named risks and how they are reflected in the scenarios |
| Can we trust you next time? | Monthly forecast versus actual reporting |
Step 1: build the baseline forecast
Separate brand from non brand
Branded searches grow with advertising, PR and word of mouth, not mainly with SEO. Split Search Console and analytics data into branded and non branded queries and forecast them separately. Claim only non branded growth as the SEO programme’s contribution.
Account for seasonality and trend
Use at least 24 months of data. A simple and defensible baseline is the same month last year adjusted by the recent year on year trend. If your data is stable, a seasonal time series model can add prediction intervals, but finance teams often trust a simple, explainable baseline more than a complex one. In the UAE, account for Ramadan moving earlier each year with the lunar calendar, summer slowdowns and seasonal peaks such as back to school.
Step 2: estimate keyword level opportunity
Take your revenue keyword set. For each keyword, record current position, a realistic target position and your own click through rate at each position, calculated from Search Console data for similar keywords. Incremental clicks = monthly searches × (click through rate at target − click through rate now).
| Keyword | Searches | Now | Target | Clicks now | Clicks at target | Incremental |
|---|---|---|---|---|---|---|
| Keyword A | 2,400 | 7 | 2 | 96 | 432 | 336 |
| Keyword B | 1,300 | 12 | 3 | 13 | 143 | 130 |
| Keyword C | 880 | 5 | 1 | 62 | 238 | 176 |
| Keyword D | 600 | Not ranking | 3 | 0 | 66 | 66 |
Set targets honestly. A keyword in position 7 with a strong page might reach position 2; a keyword where marketplaces hold the top five might realistically reach position 6. Repeat for the full set and add up the incremental clicks at full potential.
Step 3: apply a ramp curve for timing
Rankings do not jump on day one. Apply a ramp curve that shows the share of full potential reached each month. Base it on your own history if you have it; otherwise use a cautious curve like this one and say so in the assumptions:
| Month | 1 | 2 | 3 | 4 | 5 | 6 | 7 | 8 | 9 | 10 | 11 | 12 |
|---|---|---|---|---|---|---|---|---|---|---|---|---|
| Share of potential | 5% | 10% | 15% | 25% | 35% | 45% | 55% | 65% | 75% | 82% | 88% | 92% |
Keywords already ranking 4 to 15 usually ramp faster than keywords that need new pages. Larger models can use separate curves for each group. Our guide on how long SEO takes explains what affects the pace.
Step 4: convert clicks into revenue
- Ecommerce: incremental clicks × organic conversion rate of the relevant page type × average order value.
- B2B: incremental clicks × lead conversion rate × lead to opportunity rate × win rate × first year contract value, shifted forward by your average sales cycle.
- Services and clinics: incremental clicks × enquiry rate × booking rate × average first visit or treatment value.
Use conversion rates from your own analytics and CRM, by page type, for the last 6 to 12 months. Finance teams will check them against their own numbers.
Step 5: present three forecast scenarios
How the scenarios differ
| Scenario | Share of keywords reaching target | Use when |
|---|---|---|
| Conservative | 50% | Plan budgets and commitments on this |
| Expected | 75% | Most likely outcome if the plan is delivered |
| Stretch | 100% | Everything goes to plan, with no major algorithm or competitor setbacks |
Illustrative example: an ecommerce forecast
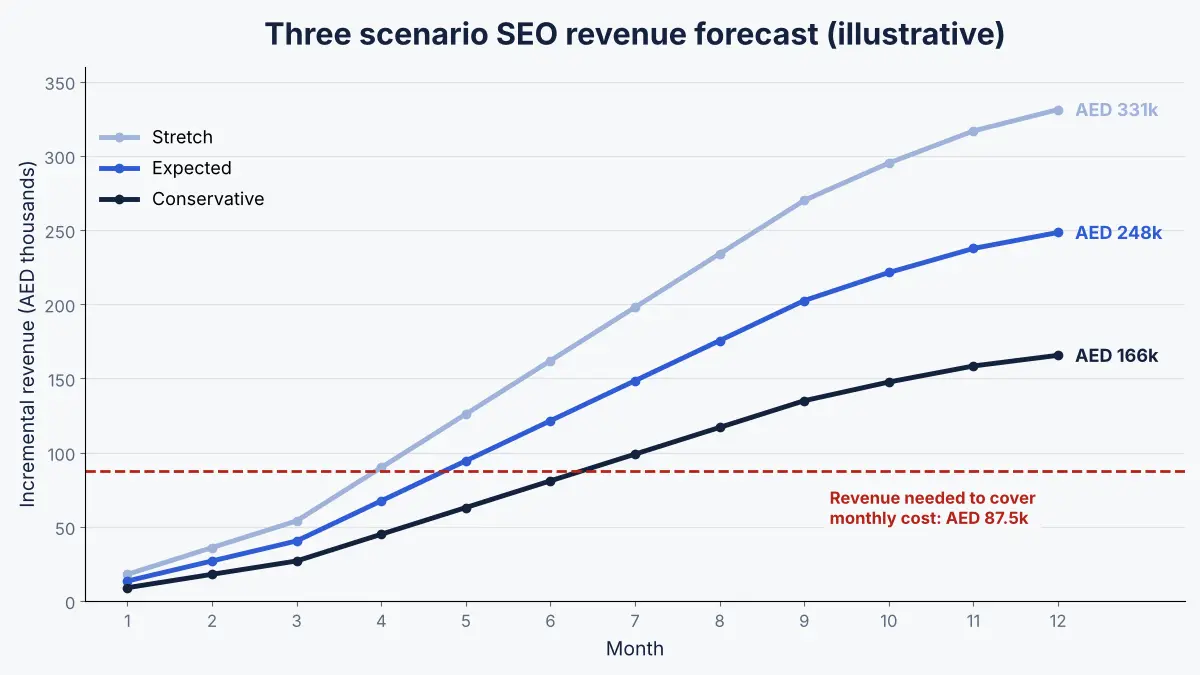
An online retailer’s 100 revenue keywords add up to 9,000 incremental clicks a month at full potential. Organic conversion rate on category pages is 2%, average order value is AED 2,000, contribution margin is 40% and the SEO programme costs AED 35,000 a month. Applying the ramp curve:
| Scenario | Year 1 incremental revenue | Month 12 revenue | Year 1 contribution | Payback month |
|---|---|---|---|---|
| Conservative | AED 1,065,600 | AED 165,600 | AED 426,240 | 12 |
| Expected | AED 1,598,400 | AED 248,400 | AED 639,360 | 9 |
| Stretch | AED 2,131,200 | AED 331,200 | AED 852,480 | 7 |
Payback is the month when cumulative contribution covers cumulative cost. Even the conservative case pays back within the first year, which is the conversation finance wants to have. Our guide to calculating SEO ROI covers the return on investment side in more detail.
A short script for scenario forecasts
full_clicks = 9000      # incremental clicks a month at full potential
cvr = 0.02              # organic conversion rate
aov = 2000              # average order value (AED)
margin = 0.40           # contribution margin
cost = 35000            # monthly SEO cost (AED)
ramp = [0.05, 0.10, 0.15, 0.25, 0.35, 0.45,
        0.55, 0.65, 0.75, 0.82, 0.88, 0.92]

for name, share in [("Conservative", 0.5), ("Expected", 0.75), ("Stretch", 1.0)]:
    revenue = [full_clicks * share * r * cvr * aov for r in ramp]
    cumulative, payback = 0, None  # cumulative contribution
    for month, rev in enumerate(revenue, start=1):
        cumulative += rev * margin
        if cumulative >= cost * month and payback is None:
            payback = month
    print(name, round(sum(revenue)), "payback month:", payback)
Step 6: adjust the forecast for risk
AI Overviews and click through rates
Ahrefs research on 300,000 keywords estimated that an AI Overview reduces the click through rate of the top ranking page by about 58%. If any revenue keywords show AI Overviews, use click through rates measured on those results pages, or apply a haircut in the conservative scenario. This is also why forecasts built on informational traffic are risky.
Core updates
Google ran broad core updates in December 2025, March 2026 and May 2026, according to Search Engine Journal. Several updates a year is normal, so a 12 month forecast should expect at least two or three. Note in the assumptions that an update can move rankings either way, and that the conservative case allows for a setback.
Delivery and competition risks
- Development capacity: if new pages or technical fixes depend on engineering, state the dependency and the dates.
- Competitor investment: a competitor launching a big content push can slow progress on shared keywords.
- Stock, pricing and site changes: a replatform or price rise changes conversion rates.
An assumptions log template
| Assumption | Value | Source | Owner | Review date |
|---|---|---|---|---|
| Click through rate at position 2 | 18% | Search Console, revenue keywords, last 6 months | SEO lead | Quarterly |
| Category page conversion rate | 2% | Analytics, organic, last 12 months | Analytics lead | Quarterly |
| Average order value | AED 2,000 | Finance | Finance | Quarterly |
| New pages live by | Month 3 | Content plan | Content lead | Monthly |
| Technical fixes deployed by | Month 2 | Engineering roadmap | Engineering | Monthly |
Reporting forecast versus actual
- Report monthly: forecast range, actual result and the main reason for any gap.
- Track leading indicators that move first: revenue keyword coverage, positions of priority keywords and pages shipped on time.
- Reforecast every quarter with updated conversion rates and positions, and keep the original forecast visible so finance can see your accuracy over time.
Common SEO forecasting mistakes
- Forecasting traffic, not revenue. Finance cannot budget against sessions.
- One number instead of a range. It looks confident and fails the first review.
- Using industry click through rate curves. Your results pages differ; use your own data.
- Counting branded growth as SEO. It overstates the programme’s effect.
- Ignoring the sales cycle. B2B revenue arrives months after the click.
- Never comparing with actuals. Credibility comes from a track record.
How Crawl To Click builds SEO forecasts
Crawl To Click is the SEO and AI visibility practice of Indu Priya, with more than 15 years of experience and more than 30 clients across the US, MENA and India, in healthcare, ecommerce, BFSI and fintech, beauty, fashion and lifestyle, and B2B software. Growth forecasting is part of the performance pillar of our method, alongside custom reporting dashboards, KPI tracking and cohort analysis.
We build every forecast bottom up from the client’s revenue keyword set, using their own Search Console click through rates, analytics conversion rates and finance team figures for order and contract values, so the inputs are numbers finance already recognises. We present conservative, expected and stretch scenarios with a written assumptions log, model the sales cycle for B2B and seasonality for ecommerce and healthcare, and include payback against the programme’s cost. Once the work starts, Python scripts and Power BI or Looker Studio dashboards compare forecast with actual every month, and we reforecast each quarter. Read more about us.
FAQs on SEO forecasting
How do you forecast SEO results?
Start with a seasonal baseline for non branded traffic, estimate incremental clicks from realistic ranking gains on your revenue keywords using your own click through rates, apply a ramp curve for timing, and convert clicks to revenue with your real conversion rates and deal values.
How accurate are SEO forecasts?
No SEO forecast is exact, because rankings depend on competitors and algorithm updates. Presenting conservative, expected and stretch scenarios, with assumptions written down and monthly comparison with actuals, makes forecasts useful and credible.
Should an SEO forecast include branded traffic?
Forecast it separately. Branded demand is driven mainly by advertising, PR and word of mouth, so only non branded growth should be credited to the SEO programme.
How do AI Overviews affect SEO forecasts?
They can reduce clicks on results pages where they appear. Use click through rates measured on those pages, or apply a reduction in the conservative scenario, especially for informational keywords.
How often should an SEO forecast be updated?
Compare forecast with actual every month and reforecast every quarter with updated positions and conversion rates, keeping the original forecast visible to show accuracy over time.
Need an SEO forecast your finance team will sign off?
Budget review coming up and your SEO case rests on a traffic chart? Request an SEO forecast built from your own data, with scenarios and payback your finance team can test.
Disclaimer: All keywords, rates and revenue figures in the examples are imaginary and for illustration only. Forecasts are estimates, not guarantees. Study findings and update dates are summarised from the linked sources.