An online home furnishing retailer in the UAE shows its board a 40% rise in organic traffic. Revenue from organic search is flat. When we pull the rankings apart, the reason is plain: the growth came from blog posts about decorating ideas, while the searches that actually sell sofas, beds and dining tables, such as “sofa bed Dubai” and “buy dining table online UAE”, sit on page two. Traffic went up. Coverage of the searches that pay did not.
The short answer: search coverage is the share of your revenue keywords, the searches that actually lead to sales, demos or bookings, where your site ranks in the top positions. Pick the 100 keywords that drive the most revenue, track where you rank for each, and report the percentage where you hold a top 3 position, ideally weighted by each keyword’s value. Unlike traffic or average position, coverage moves with revenue, which is why it is the SEO metric that finance teams and founders understand.
This hub explains how to define, measure, model and improve search coverage, and links to deeper guides on each part. Brand names in the examples are imaginary.
Why traffic and average rankings mislead
Clicks concentrate at the top
A Backlinko analysis of 4 million Google results found that the number one result has an average click through rate of 27.6% and is 10 times more likely to receive a click than a page in position 10. Moving a revenue keyword from position 8 to position 2 changes revenue. Moving an informational keyword from position 40 to position 25 changes a chart and nothing else. Average position blends both together and hides the difference.
AI Overviews are shrinking informational clicks
Ahrefs research on 300,000 keywords estimated that an AI Overview reduces the click through rate of the top ranking page by about 58%, comparing December 2023 with December 2025. Informational queries are the ones most likely to show AI Overviews, so traffic built on them is the traffic most at risk. Commercial and transactional searches, the core of a revenue keyword set, are where organic clicks still convert.
Traffic growth can hide revenue decline
In audits I run, the most common pattern behind “SEO is not working” is exactly the retailer above: a content programme that wins thousands of low value searches while competitors hold the few hundred that make money. A coverage metric exposes this in one number.
What search coverage means
The basic formula
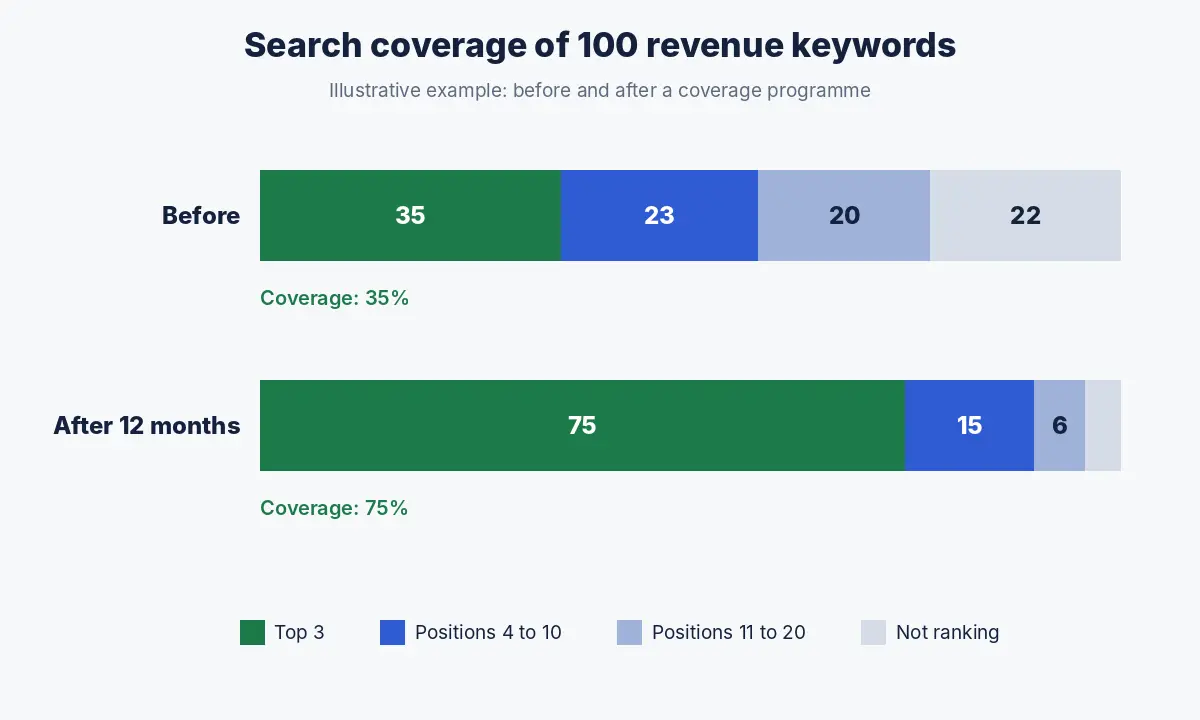
Search coverage = (revenue keywords where you rank in the top 3 ÷ total revenue keywords) × 100. If you track 100 revenue keywords and hold a top 3 position for 35 of them, your coverage is 35%.
Three versions of the coverage metric
| Version | How it is calculated | Best for |
|---|---|---|
| Simple coverage | Share of revenue keywords in the top 3 | Quick monthly reporting; easy to explain |
| Weighted coverage | Sum of the value of keywords in the top 3 ÷ total value of all revenue keywords | Sets where a few keywords carry most of the revenue |
| Click share | Your estimated clicks ÷ total available clicks for the keyword set | Forecasting and comparing with competitors |
Use simple coverage for the headline and weighted coverage for decisions. Keyword value is monthly searches × your conversion rate for that intent × average order or deal value.
Why top 3 is the right threshold
Top 3 captures most of the clicks on a typical results page while being specific enough to show progress. For very competitive categories, also track top 10 coverage as an early indicator, since keywords usually reach page one before they reach the top three.
Building your revenue keyword set
Where revenue keywords come from
- Search Console and analytics: landing pages with conversions, and the queries that bring traffic to them.
- Paid search: keywords with proven conversion rates in your ad account are the clearest evidence of commercial intent.
- Sales and support teams: the words customers use on calls, in chats and in enquiry forms.
- Competitors: commercial keywords where competitors rank and you do not.
- Product and location combinations: “[product] + [city]”, “[service] + near me”, “[software] for [industry]”.
Filter for intent and value
Keep a keyword only if someone searching it could buy, book or request a demo within a few steps. Then rank by value and keep the top 100. That number is large enough to be representative and small enough to review keyword by keyword. Larger sites can track several sets of 100, one per product line or market.
Illustrative example: revenue keywords by business type
| Business | Revenue keyword examples | Not revenue keywords |
|---|---|---|
| Furniture ecommerce | sofa bed Dubai, buy dining table online UAE | living room decor ideas |
| B2B software | influencer CRM software, [competitor] alternatives | what is influencer marketing |
| Dental clinic | invisalign cost Dubai, emergency dentist Jumeirah | how to whiten teeth naturally |
| Fintech | business account UAE online, payroll card for SMEs | what is a payroll card |
How to measure search coverage
Tracking setup
- Load the revenue keyword set into a rank tracker, set to your target country, city and device. For the UAE, track English and Arabic versions separately.
- Tag each keyword by product line, funnel stage and target page.
- Record the ranking URL, not just the position. A blog post ranking for a product keyword is a coverage gap, even in the top 3.
- Calculate simple and weighted coverage on the first of each month.
- Check Search Console for the same keywords to confirm impressions and clicks.
A coverage report you can copy
| Metric | Last month | This month | Target |
|---|---|---|---|
| Simple coverage (top 3) | 35% | 39% | 60% in 12 months |
| Weighted coverage | 28% | 34% | 55% in 12 months |
| Top 10 coverage | 58% | 63% | 85% in 12 months |
| Keywords not ranking | 22 | 18 | Under 5 |
| Organic revenue from revenue keyword pages | AED 410,000 | AED 455,000 | Plan |
The figures above are illustrative. Your targets should come from your own baseline and competitor positions.
Connecting search coverage to revenue
Use your own click through rates
Industry click through rate curves are averages across very different results pages. For revenue modelling, export your own Search Console data for the revenue keyword set, group it by position (1, 2, 3, 4 to 5, 6 to 10) and calculate your actual click through rate for each band. That curve already reflects your results pages, your snippets and the ads and AI features above you.
Illustrative example: the value of one position move
Say “sofa bed Dubai” has 2,400 monthly searches. The retailer’s own data shows a 4% click through rate at position 7 and an 18% rate at position 2, a 2.5% conversion rate and an average order of AED 2,200.
| Position 7 | Position 2 | |
|---|---|---|
| Monthly clicks | 96 | 432 |
| Orders (2.5%) | 2.4 | 10.8 |
| Monthly revenue | AED 5,280 | AED 23,760 |
One keyword, one position move, roughly AED 18,000 more revenue a month. Repeat the calculation across the 100 keywords and you have a revenue forecast tied directly to coverage. Our guide to calculating SEO ROI shows how to turn this into a return on investment.
How to improve search coverage
Diagnose each gap
| Gap | Usual cause | Fix |
|---|---|---|
| Not ranking at all | No page targets the keyword | Create a dedicated page of the type that ranks (category, product, service or comparison page) |
| Wrong page ranking | A blog post or the home page competes with the commercial page | Consolidate, fix internal links and anchor text, sharpen titles |
| Positions 11 to 20 | Page is relevant but weak | Improve content depth, answer related questions, add internal links from strong pages |
| Positions 4 to 10 | Competitors have more authority or better pages | Upgrade the page, earn links and mentions, improve speed and user experience |
| Top 3 but low revenue | Page does not convert | Conversion rate optimisation on the landing page |
Prioritise by value and distance
Start with keywords that are both valuable and close: positions 4 to 15 with high value. They move fastest and pay most. Keywords where you do not rank at all usually need new pages and take longer; schedule them in parallel, not first.
Use People Also Ask to strengthen commercial pages
The People Also Ask questions shown for a revenue keyword are a ready list of buyer concerns: delivery times, sizes, warranties, prices. Answering them on the product or category page, in short sections, improves relevance for the keyword and helps buyers decide.
Fix the technical basics
Commercial pages in ecommerce and listings sites often suffer from slow templates, faceted navigation that creates duplicates and thin category copy. A technical review of the templates that carry revenue keywords is part of every coverage plan; our SEO audit guide covers what to check.
Search coverage in AI search
The same revenue keyword set works as a prompt set for AI assistants. Turn each keyword into a natural question (“What is the best place to buy a sofa bed in Dubai?”) and measure how often your brand is mentioned. Our guide to measuring LLM mentions per 100 queries explains the sampling method. Reporting Google coverage and AI mention rate on the same keyword set gives leadership one view of visibility across both channels.
Reporting search coverage to leadership
What founders and finance teams want to see
- One headline: coverage of revenue keywords, this month versus last month and versus target.
- The revenue or pipeline from pages that target those keywords.
- The five biggest wins and five biggest gaps, by value.
- What will be done next month, and which keywords it should move.
Realistic timelines
Keywords already in positions 4 to 15 can often move within one to three months of focused work. New pages for keywords where you do not rank usually take longer, depending on competition and authority. Our guide on how long SEO takes covers what affects the timeline.
Common search coverage mistakes
- Including informational keywords because they have high volume. They inflate the set and dilute the metric.
- Ignoring the ranking URL. A blog post in position 2 for a product keyword may not convert.
- Tracking the wrong location or language. National rankings can differ greatly from Dubai or Abu Dhabi rankings, and from Arabic results.
- Changing the keyword set every month. Review it every quarter, not every report.
- Stopping at rankings. Coverage is the leading indicator; revenue is the result. Report both.
Guides in this search coverage series
- Building a revenue keyword set: the top 100 keywords that actually pay
- Content pruning with conversion data: removing pages that bring traffic but no business
- Bottom of funnel content for SaaS: pages that generate demos, not pageviews
- SEO forecasting that finance teams accept
- Persona and intent mapping: from customer interviews to a topic map
- CRO for organic landing pages: turning rankings into leads
How Crawl To Click improves search coverage
Our approach
Crawl To Click is the SEO and AI visibility practice of Indu Priya, with more than 15 years of experience and more than 30 clients across the US, MENA and India, in healthcare, ecommerce, BFSI and fintech, beauty, fashion and lifestyle, and B2B software. Search coverage sits at the heart of the first stage of our method, “find what converts”: we identify the small share of topics that actually influence revenue, prioritise content that drives sales, demos and qualified leads, and remove pages that bring traffic without business impact. Read more about us.
Results across industries
- Ecommerce (online furniture and home retail): facing strong competition, changing results layouts and core updates, we prioritised positions 1 and 2 for the top 100 revenue keywords. Coverage of those keywords rose from 35% to 75%, and revenue grew 6x between 2019 and 2022.
- B2B marketing software: starting from scratch, bottom of funnel content aimed at qualified leads helped deliver 10x growth in demos, and the site now receives hundreds of demos a month from SEO and ChatGPT.
- Technical B2B product: in a hard to crack category, a revenue focused keyword set delivered 10x growth in impressions and recurring monthly demos from Google and ChatGPT.
- Healthcare, fintech and lifestyle brands: the same method applies to treatments and bookings, financial products and applications, and product collections, with keyword sets built around what each business actually sells.
- Startups: our founder has helped scale startups to unicorn status, adding more than 1 million organic visitors and doubling revenue within a year.
FAQs on search coverage
What is search coverage in SEO?
Search coverage is the percentage of your revenue keywords, the searches that lead to sales, bookings or demos, where your site ranks in the top positions, usually the top 3. It ties rankings directly to revenue.
How is search coverage different from share of voice?
Share of voice usually estimates your share of all clicks across a broad keyword set. Search coverage focuses only on revenue keywords and counts where you hold top positions, which makes it simpler to explain and closer to revenue.
How many keywords should a revenue keyword set include?
Around 100 for most businesses: large enough to be representative and small enough to review individually. Larger sites can track a set of 100 for each product line or market.
What is a good search coverage percentage?
It depends on your category and starting point. Measure your baseline and competitors first, then set a 12 month target. Moving a large share of high value keywords into the top 3 usually has a visible effect on revenue.
Does search coverage apply to AI search?
Yes. Turn the revenue keywords into natural questions and track how often AI assistants mention your brand. Reporting Google coverage and AI mention rate on the same set gives one view across both channels.
Need help measuring your search coverage?
Traffic going up but revenue standing still? Request a search coverage audit and see exactly which revenue keywords you are missing and what they are worth.
Disclaimer: The retailer, keyword volumes, click through rates, conversion rates and revenue figures in the examples are imaginary and for illustration only. Study findings are summarised from the linked research. Client results come from work led by our founder and depend on market, product and execution.