A marketing head at a Dubai property portal sees organic leads fall 22% quarter on quarter. The Search Console chart shows impressions up and clicks down, and the agency’s report says “AI Overviews”. Is that true for every page, or only for guides? Which listings lost rankings, and which only lost click through rate? Answering that by hand means pivot tables across thousands of rows. With both periods exported and uploaded to Claude, the answer takes one well written prompt, and the script it writes can be rerun next month.
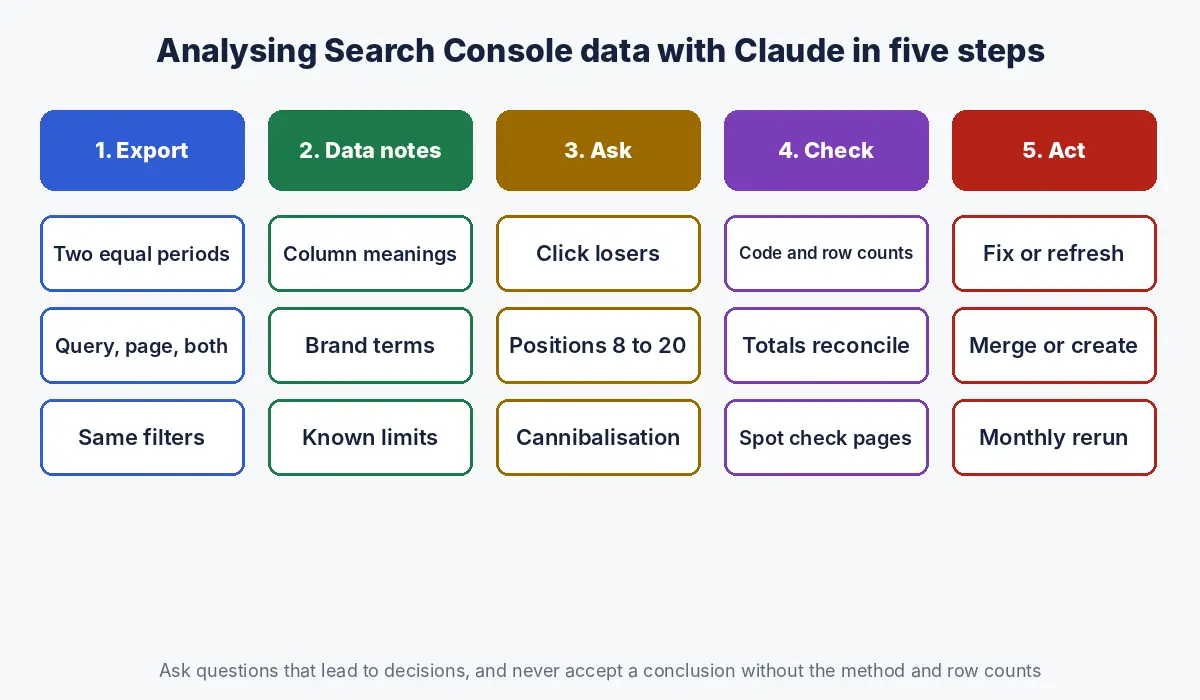
The short answer: to analyse Search Console data with Claude, export query and page level performance data for two comparable periods, upload the files with a short note on what each column means, and ask specific diagnostic questions: which pages lost clicks, whether the loss came from impressions or click through rate, which queries sit in positions 8 to 20, and where two pages compete for one query. Ask Claude to show its method and row counts, spot check results against the Search Console interface, and remember the interface export is capped at 1,000 rows, so larger sites need the API or the BigQuery bulk export.
Why analyse Search Console data with Claude?
Claude turns Search Console exports into answers to specific business questions faster than manual spreadsheet work, because it can join periods, group queries by meaning, and write and run the analysis code, while showing its method so you can check it.
The Search Console interface is good at showing what happened and weak at explaining why. Comparing two periods by page, separating ranking losses from click through rate losses, grouping thousands of queries into topics, and spotting cannibalisation all need work outside the interface. That work is repetitive and rule based, which is exactly where an assistant that writes and runs code saves time.
This guide is part of our Claude for SEO series. For large exports, logs and scripted analysis on your own machine, see Claude Code for SEO.
How do you get Search Console data into Claude?
Get Search Console data into Claude by exporting from the interface for small sites, pulling from the Search Analytics API or a Sheets or Looker Studio connection for larger ones, using the BigQuery bulk export for very large sites, or using a connector where one is available.
| Method | Row limit | Best for |
|---|---|---|
| Interface export (CSV, Sheets, Excel) | 1,000 rows per table (Google Search Central) | Small sites, quick checks |
| Search Analytics API, directly or via a connector tool | Up to 50,000 rows per day, per site, per search type (Fivetran, citing Google) | Most business sites |
| BigQuery bulk export | Daily export of performance data to your own BigQuery project (Google Search Central) | Large sites and long term history |
| Claude connector or MCP server | Depends on the connector (Claude documentation) | Teams that run this analysis often |
For most analysis you need two exports per period: one by query and one by page. If your tool allows it, a third export with both query and page together is the most useful file of all, because it shows which page ranks for which query.
Also be aware that Search Console does not show every query. Google filters out rare queries to protect user privacy, so query level totals are lower than page level totals (Google Search Central). Tell Claude this, or it may report the gap as an error.
How do you prepare Search Console exports so Claude reads them correctly?
Prepare exports by naming files clearly with the period, keeping the original column headers, using the same filters for both periods, and giving Claude a short data dictionary that explains each column and known limitations.
DATA NOTES (paste with your upload)
Files:
  gsc_queries_2026Q2.csv / gsc_queries_2026Q3.csv  (by query)
  gsc_pages_2026Q2.csv   / gsc_pages_2026Q3.csv    (by page)
  gsc_query_page_2026Q3.csv                        (query + page)
Columns: Clicks, Impressions, CTR (as %), Position (average).
Filters: Web search, all countries, all devices.
Known limits: interface exports cap at 1,000 rows; rare queries
are anonymised, so query totals are below page totals.
Site: example.com (property portal, UAE). Brand terms: example,
example.com, ex ample.
Listing brand terms lets Claude split branded from non branded traffic, which changes the story in almost every report: a brand campaign can hide a non branded decline, and vice versa.
If you run this analysis every month, put the data notes and your brand terms into a Claude Project, whose instructions and knowledge apply to every chat in it (Claude Help Center), so you only upload the new files.
Which Search Console questions should you ask Claude?
Ask Claude questions that lead to a decision, such as which pages to fix, which to refresh, which to merge and which queries deserve new content, rather than asking it to “analyse the data”.
| Question | What it tells you | Decision it supports |
|---|---|---|
| Which 20 pages lost the most clicks, and was it impressions or CTR? | Whether you lost rankings or lost clicks at the same ranking | Fix rankings vs fix titles, snippets or format |
| Which queries rank 8 to 20 with meaningful impressions? | Pages close to page one | Quick win optimisation list |
| Which queries have two or more of our pages with impressions? | Possible cannibalisation | Merge, differentiate or reinforce one page |
| Which pages have impressions but almost no clicks? | Poor titles, mismatched intent or SERP features | Rewrite titles and descriptions, or change format |
| How do branded and non branded clicks compare across periods? | Whether growth is real or brand led | Budget and content priorities |
| Which topics grew and which declined? | Shifts in demand or visibility by theme | Content plan |
| Which pages lost clicks while rankings held steady? | Likely SERP layout or AI feature impact | Measure AI exposure, adjust content |
How do you find which pages lost clicks, and why?
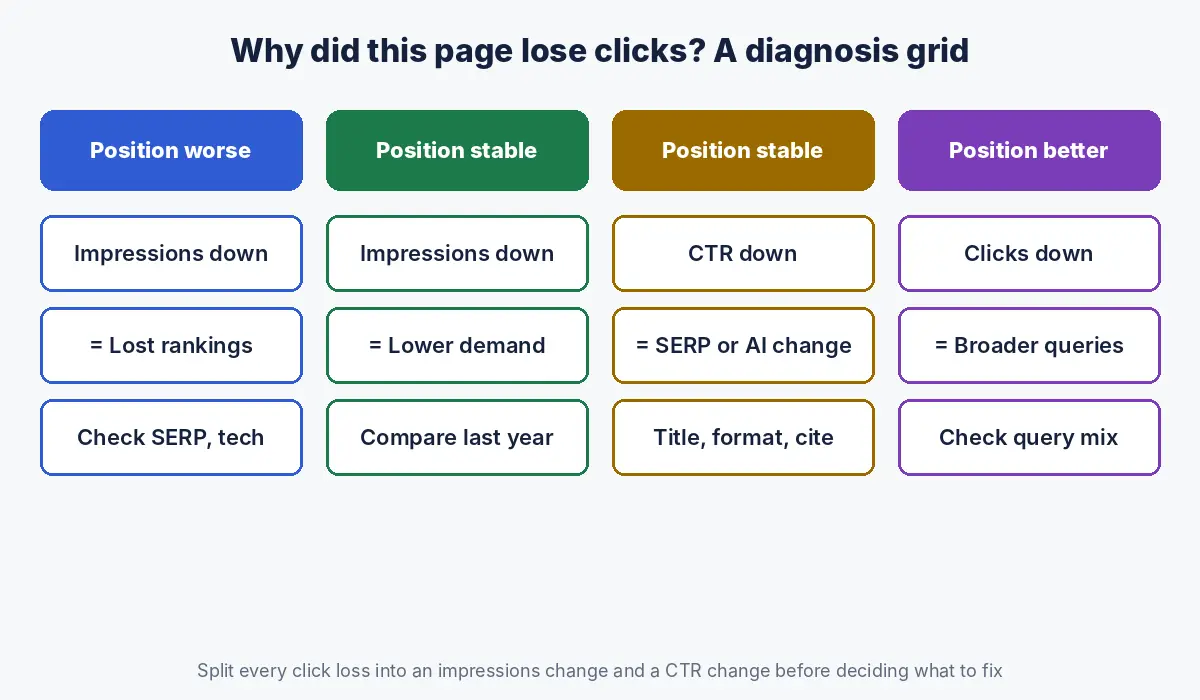
Compare page level data for two equal periods, rank pages by click loss, and split each loss into an impressions change and a CTR change, because falling impressions point to lost rankings or demand, while falling CTR at steady positions points to titles, intent or SERP features.
Using gsc_pages_2026Q2.csv and gsc_pages_2026Q3.csv:
1. Join on page URL. Report pages in only one period separately.
2. Rank pages by click change. Show the top 20 losers with clicks,
   impressions, CTR and position for both periods.
3. For each, estimate how much of the loss came from impressions
   and how much from CTR.
4. Label each: RANKING (position worsened by 2+), DEMAND (position
   stable, impressions down), CTR (position stable, CTR down).
Show row counts after the join and the code you used.| Pattern | Likely cause | Next step |
|---|---|---|
| Position worse, impressions down | Lost rankings: competitor, core update, technical issue | Check the live results and the page’s technical health |
| Position stable, impressions down | Lower demand: seasonality or trend | Compare with the same period last year |
| Position stable, impressions stable, CTR down | SERP change: AI Overview, new features, competitor titles | Check the results page; review title and description |
| Position better, clicks down | Ranking for broader queries with lower intent | Check which queries drive the impressions |
The CTR pattern has become more common. Ahrefs estimated that an AI Overview reduces the click through rate of the top ranking page by about 58% (Ahrefs), so pages can lose clicks without losing a single position.
How do you find quick wins in positions 8 to 20?
Filter queries with an average position between 8 and 20 and enough impressions to matter, group them by the page that ranks, and prioritise pages where several such queries share commercial intent.
From gsc_query_page_2026Q3.csv, list queries with average
position 8 to 20 and at least 200 impressions. Group by page.
For each page: number of such queries, total impressions,
and the 5 largest queries. Mark queries with commercial intent
(price, cost, best, near me, vs, service names). Sort pages by
total impressions of commercial queries.
Average position is an average across impressions, and Google calculates it differently for the chart and the table (Search Console Help). Treat 8 to 20 as a shortlist to check in the live results, not a precise measurement.
How do you detect keyword cannibalisation in Search Console data?
Detect cannibalisation by finding queries where two or more of your pages receive meaningful impressions in the same period, then checking whether rankings alternate between them over time.
From gsc_query_page_2026Q3.csv, find queries where 2 or more
pages each have at least 20% of the query's impressions.
For each query: the pages, their impressions, clicks and average
position. Flag pairs where neither page ranks in the top 5.
Not every overlap is a problem. A category page and a guide can both deserve to rank for a broad query. It becomes a problem when neither reaches the top results and both target the same intent; then merge, redirect or clearly differentiate them.
How do you group queries into topics and intent with Claude?
Ask Claude to cluster queries into topics by meaning, label each cluster with an intent and funnel stage, and summarise clicks and impressions per cluster, which turns thousands of rows into a short list of themes you can plan content around.
This is where Claude saves the most time compared with spreadsheet rules. When we grouped a seven day query export for this site by theme, queries about AI search, AI visibility and AI tools made up about 11.5% of impressions, a share we would not have seen from the top queries list alone, and one that shaped which articles we wrote next.
Cluster the queries in gsc_queries_2026Q3.csv into 15 to 25
topics by meaning. For each topic: a short label, intent
(informational, commercial, transactional, navigational),
funnel stage, total clicks and impressions, top 5 queries,
and the page that gets most impressions. Put brand queries
in their own cluster.
Then join the clusters to your conversion data. Topics that drive traffic but no enquiries are candidates for content pruning with conversion data, and topics close to revenue belong in your revenue keyword set.
How do you measure AI Overviews and AI Mode impact with Search Console and Claude?
Use Search Console’s generative AI performance reports, where available, to see impressions in AI Overviews and AI Mode by page, and combine them with your normal performance data in Claude to see which pages gained AI exposure while losing clicks.
Google introduced Search Generative AI performance reports in June 2026, rolling out gradually (Google Search Central). According to Search Engine Journal’s reading of the launch, the report currently shows impressions only, segmented by page, country, device and date, and does not include queries, clicks, click through rate or average position (Search Engine Journal). An impression is counted when a link to your site is shown in an AI Overview or AI Mode response.
| What you can measure | How |
|---|---|
| Pages most exposed in AI features | Gen AI report impressions by page |
| Pages losing clicks at stable rankings | Standard performance data, two periods |
| Overlap of the two | Ask Claude to join both files by page |
| Traffic from AI assistants | Analytics referrals from chatgpt.com, perplexity.ai, gemini.google.com |
A page with rising AI impressions and falling clicks at steady positions is the clearest signal that answers are being given on the results page. The response is not to chase the lost click, but to make sure the page is the cited source and that it gives a reason to visit: data, tools, examples or a next step the summary cannot provide.
How do you check that Claude’s Search Console analysis is right?
Check Claude’s analysis by asking for its code and row counts, reconciling totals against the Search Console interface, spot checking a few pages by hand, and confirming it treated CTR and position correctly.
- Ask for row counts after every join and filter; unexplained drops usually mean URL mismatches such as trailing slashes or http and https variants.
- Compare total clicks and impressions with the Search Console interface for the same filters.
- Check that CTR was recalculated from clicks and impressions, not averaged across rows.
- Check that position was weighted by impressions when combining rows.
- Open three pages from the top losers list in Search Console and confirm the numbers.
- Save the code, so next month’s run uses the same method.
How do you turn the analysis into a monthly report?
Turn the analysis into a report by fixing the questions, the file names and the output format, then rerunning the same prompts each month and asking Claude to write a short plain language summary for leadership on top of the tables.
Our SEO report template lists what a monthly report should contain. A useful structure: three headline numbers, the five biggest changes with causes, the quick wins list, and actions agreed for next month. Keep the commentary human; Claude can say clicks fell 18%, but someone who knows the business must say whether that matters.
What are the common mistakes when analysing Search Console data with Claude?
| Mistake | Fix |
|---|---|
| Uploading only the 1,000 row interface export for a large site | Use the API, a connector or the BigQuery export |
| Comparing periods of different lengths or seasons | Equal periods; add year on year for seasonal sites |
| Averaging CTR or position across rows | Recalculate CTR; weight position by impressions |
| Mixing filters between periods | Same search type, countries and devices in both |
| Treating anonymised query gaps as errors | Tell Claude rare queries are filtered for privacy |
| Accepting conclusions without the method | Ask for code, row counts and a reconciliation |
How Crawl To Click analyses Search Console data
Crawl To Click is an SEO and AI visibility consultancy, and Search Console is the first data source we open in every engagement. We export two comparable periods by query, page and both together, split branded from non branded demand, separate ranking losses from click through rate losses, and group queries into topics joined to conversion data, with every step scripted and reconciled against the interface. The output is a short list of decisions: pages to fix, refresh, merge or create. We apply this to property portals, software companies, clinics, schools, ecommerce stores and professional services firms in the UAE and India.
FAQs on analysing Search Console data with Claude
Can Claude analyse Google Search Console data?
Yes. Claude can analyse Search Console exports you upload, such as performance data by query and by page, compare periods, separate ranking losses from click through rate losses, group queries into topics and find cannibalisation, and it can show the code it used so you can check and rerun it.
How do I export more than 1,000 rows from Search Console?
The Search Console interface exports up to 1,000 rows per table. For more, use the Search Analytics API directly or through a connector tool, which allows up to 50,000 rows per day per site and search type, or set up the BigQuery bulk export for large sites.
Why do query totals not match page totals in Search Console?
Search Console filters out rare queries to protect user privacy, so totals in the query report are lower than totals in the page report for the same period. This is expected and should be explained to Claude before analysis.
Can Search Console show traffic from AI Overviews?
Search Console’s generative AI performance reports, introduced in June 2026 and rolling out gradually, show impressions in AI Overviews and AI Mode by page, country, device and date. They do not currently show clicks, queries or position.
What is the best Claude prompt for Search Console analysis?
The best prompts ask one specific question that leads to a decision, name the files and columns, define thresholds such as positions 8 to 20 or 200 impressions, and ask Claude to show row counts and the code it used.
Is it safe to upload Search Console data to Claude?
Search Console data is usually aggregated and contains no personal information, but it is commercially sensitive. Follow your company’s or client’s data policy, use a business plan with settings that suit it, and avoid uploading files that contain personal data.
Want an independent read of your Search Console data?
Not sure whether a traffic drop is rankings, demand or AI Overviews? Request a Search Console review and get a clear diagnosis and a short list of fixes.
Disclaimer: This article reflects Google and Anthropic documentation and published reporting as of the dates stated. Search Console reports and limits change over time. Prompts are examples to adapt, and the opening scenario is illustrative.