A marketing head runs “best helpdesk software in Dubai” through ChatGPT on Monday and her brand is the second recommendation. She runs it again on Tuesday for the board update and the brand is not mentioned at all. Which result goes in the report? Neither. A single answer from an AI assistant is a sample of one, and it tells you almost nothing about your real visibility.
The short answer: measure LLM mentions as a rate, not a ranking. Build a fixed set of category prompts, run each one several times on each AI platform in clean sessions, and count how many answers mention your brand out of every 100. With at least 200 answers per platform per month, the figure is stable enough to track; with fewer, you are mostly measuring noise. Report it with its margin of error and act only on changes that hold for two months.
This guide is part of our series on entity SEO for AI search. It sets out the exact sampling method, the sample size maths, a scoring sheet and a reporting format you can take to leadership. Brand names in the examples are imaginary.
Why single AI answers cannot measure LLM visibility
How much AI answers vary
Research led by Rand Fishkin of SparkToro and Patrick O’Donnell of Gumshoe, reported by Search Engine Land, had 600 volunteers run 12 identical prompts nearly 3,000 times across ChatGPT, Claude and Google’s AI. The chance of getting the same list of recommendations twice was under 1 in 100, and the chance of the same list in the same order was closer to 1 in 1,000.
What stays stable
The same study found that how often a brand appears held up far better than its position: some brands appeared in 60% to 90% of responses for a given intent. That is the key insight behind this method. Position in an AI answer is close to random; the frequency of mentions across many runs is a real, measurable signal.
Defining LLM mentions per 100 queries
The core metric
Mentions per 100 queries = (answers that name your brand ÷ total answers collected) × 100. If you collect 480 answers in a month and 72 name your brand, your rate is 15 per 100. It is simple enough to explain to a chief executive and robust enough to track monthly.
Supporting metrics from the same data
| Metric | What it counts | Why it matters |
|---|---|---|
| Recommendation rate | Answers that recommend you, not just mention you | A mention in a list of “tools to avoid” is not a win |
| Share of voice | Your mentions ÷ all brand mentions in the answers | Shows your position against named competitors |
| Citation rate | Answers that link to your domain as a source | Drives clicks and shows which pages AI trusts |
| Fact accuracy | Mentions that describe you correctly | A mention with the wrong price or category can hurt |
Step 1: build a prompt set that reflects real buyers
Three types of prompts
- Category prompts: “What is the best helpdesk software for a small ecommerce team in Dubai?”
- Problem prompts: “How can I reply to customer WhatsApp messages and emails from one inbox?”
- Comparison prompts: “What are the alternatives to [market leader] for Arabic support?”
Leave out branded prompts (“What is Brightdesk?”) from the mentions metric. Your brand will almost always appear in those answers, which inflates the rate. Track branded prompts separately for fact accuracy.
Use phrasing variants
Real buyers phrase the same need in many ways. For each buying intent, write three variants: a short one, a detailed one with context (“we are a 15 person team using Shopify”), and one with a constraint (“under AED 500 a month”). Ten intents with three variants each gives you a 30 prompt set that is broad enough to represent the category without being unmanageable.
Version and freeze the set
Give the prompt set a version number and do not edit it month to month. If you add or change prompts, start a new version and run both side by side for one month so the trend line is not broken by your own changes.
Step 2: decide how many runs you need
The sample size maths
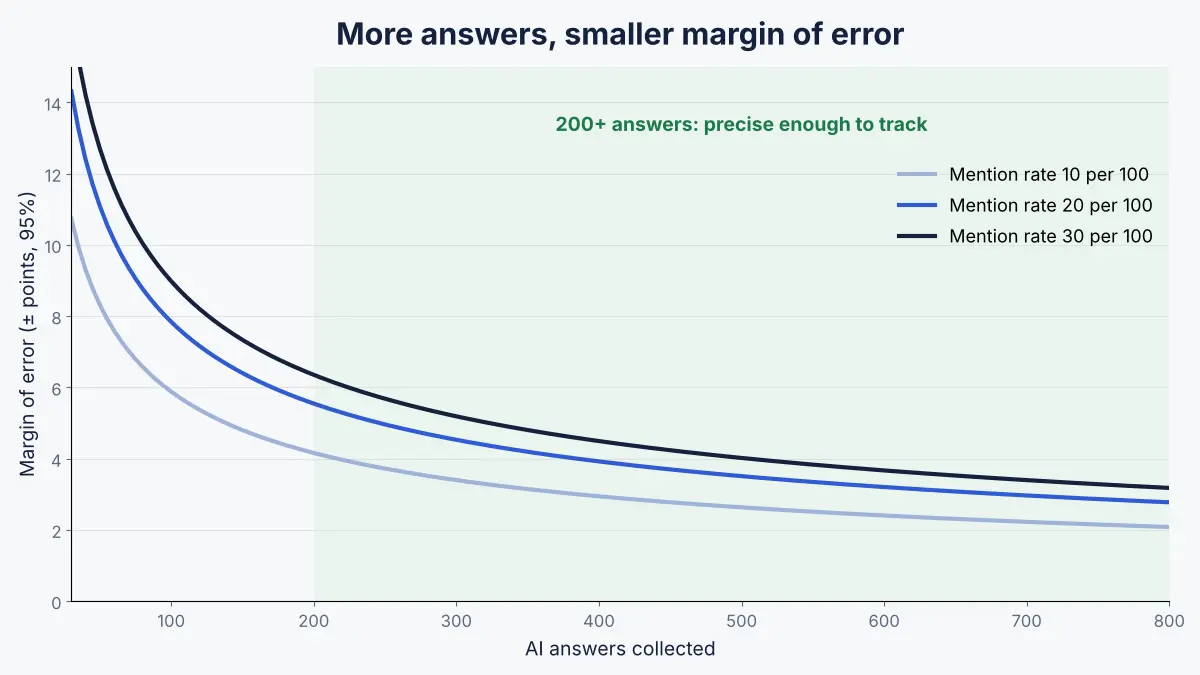
Mentions per 100 queries is a proportion, so the standard confidence interval for a proportion tells you how precise it is. At 95% confidence, the margin of error is 1.96 × √(p × (1 − p) ÷ n), where p is your mention rate and n is the number of answers. Here is what that means in practice:
| Answers collected (n) | Margin at 10 per 100 | Margin at 20 per 100 | Margin at 30 per 100 |
|---|---|---|---|
| 50 | ± 8.3 | ± 11.1 | ± 12.7 |
| 100 | ± 5.9 | ± 7.8 | ± 9.0 |
| 200 | ± 4.2 | ± 5.5 | ± 6.4 |
| 400 | ± 2.9 | ± 3.9 | ± 4.5 |
| 800 | ± 2.1 | ± 2.8 | ± 3.2 |
Read the table this way: with 50 answers, a rate of 20 per 100 could really be anywhere from about 9 to 31. That is useless for reporting. With 400 answers, the same rate sits between about 16 and 24, which is precise enough to see real movement.
A practical sampling plan
- Prompts: 30 (10 intents × 3 variants).
- Runs per prompt: 4 per platform per month, spread across different days.
- Platforms: ChatGPT, Gemini, Perplexity and Copilot, plus Google AI Overviews if they show for your queries.
- Total: 30 × 4 × 4 = 480 answers a month, or 120 per platform.
At 120 answers per platform, single platform figures carry a margin of roughly ± 7 points, so report the combined figure monthly and the per platform figures as a rolling three month average (360 answers each).
Step 3: collect AI answers in clean conditions
Rules for every run
- Use a fresh chat for every prompt, with memory and personalisation turned off.
- Use an account that has never discussed your brand, or a logged out session where the tool allows it.
- Keep the location consistent: if your market is the UAE, run from a UAE connection every time.
- Record the mode: web search on or off, default or advanced model. Do not mix modes in one metric.
- Save the full answer text, the date, the platform, the model shown and every cited URL.
- Never ask follow up questions before recording the first answer.
Manual, API or tracking tool?
Manual collection works up to a few hundred answers a month and shows you exactly what buyers see. Calling models through their APIs scales cheaply, but API answers can differ from the consumer apps, which add web search and their own system instructions. Tracking tools automate both. Whichever you choose, keep it the same each month, and check a sample of automated answers against the real apps every quarter.
Step 4: score each answer consistently
A scoring sheet you can copy
| Column | Values |
|---|---|
| Date | Run date |
| Platform and mode | For example ChatGPT, search on |
| Prompt ID | Intent number and variant, for example I04 V2 |
| Brand mentioned | 1 or 0 |
| Brand recommended | 1 or 0 |
| Position | Order in the list, for reference only |
| Domain cited | 1 or 0, plus the cited URL |
| Facts correct | 2 correct, 1 partly, 0 wrong |
| Competitors named | List of brands |
Counting rules that prevent arguments
- Count a mention only if the brand name appears in the answer text, not just in a cited link.
- Count product names as brand mentions only if they are unambiguous.
- If an answer names you negatively (“avoid Brightdesk for large teams”), count the mention but not the recommendation.
- Have two people score the same 30 answers once a quarter and compare. If they disagree on more than a few, tighten the rules.
Step 5: report LLM mentions without overreacting
Illustrative example: a monthly report
Brightdesk, an imaginary helpdesk platform in Dubai, collects 480 answers in October. It is named in 72 of them, a rate of 15 per 100, with a margin of about ± 3.2. In September, the rate was 11 per 100 on the same prompt set. The increase is larger than the margin of error on both months, and the rolling three month figure is also rising, so the team reports it as a real gain and links it to the comparison pages it published in August.
| Platform | Answers | Mentions | Per 100 | Rolling 3 months |
|---|---|---|---|---|
| ChatGPT | 120 | 22 | 18 | 14 |
| Gemini | 120 | 14 | 12 | 10 |
| Perplexity | 120 | 24 | 20 | 17 |
| Copilot | 120 | 12 | 10 | 9 |
| All | 480 | 72 | 15 | 12.5 |
When a change is real
- The change is bigger than the margin of error on both periods.
- It holds for two consecutive months, or shows up in the rolling average.
- It appears on more than one platform, or you can explain why it affected one platform only (for example a model update).
- You can link it to something you did or something that changed in the market.
For how this metric fits with traffic, conversions and citations in a full dashboard, see our guide to AEO KPIs.
Common mistakes when measuring LLM mentions
- Reporting position as a ranking. “We rank number 2 in ChatGPT” is not a stable fact, as the research above shows.
- Testing from a logged in account full of brand history. Memory and personalisation can lift your own brand.
- Counting branded prompts. They inflate the rate and hide real category visibility.
- Changing the prompt set every month. You lose the trend.
- Ignoring accuracy. A rising mention rate with wrong facts needs a fix, not a celebration. Our guide to writing a brand fact sheet covers how to correct this.
What to do when your mention rate is low
The answer data tells you where to work. Look at which competitors appear in the answers where you do not, and which domains are cited in those answers. Those are the sources AI tools trust for your category, and our guide to citation source mapping shows how to find and prioritise them. Usually the fixes fall into the layers covered in this series: a clearer brand entity, consistent facts, coverage in the sources being cited, community discussion and content that answers the prompts directly.
How Crawl To Click measures AI visibility
Our approach
Crawl To Click is the SEO and AI visibility practice of Indu Priya, with more than 15 years of experience across the US, MENA and India and more than 30 clients across healthcare, ecommerce, fintech, B2B software and lifestyle brands. Mentions per 100 queries is the main visibility metric in every AI visibility programme we run. We build the prompt set with the client’s sales team, sample in clean sessions across platforms, report with margins of error, and tie the metric to demos and revenue rather than vanity counts. Read more about us.
What the metric showed for a B2B software platform
For a B2B marketing software platform, this exact metric moved from 3 to 22 mentions per 100 tracked queries over the engagement. Because the measurement was consistent, the team could connect it to business results: the share of demos from AI assistants rose from 2% to 10%, and visitors from AI assistants converted to demos at 14%, up from 8%.
FAQs on measuring LLM mentions
What does LLM mentions per 100 queries mean?
It is the number of AI answers that name your brand out of every 100 answers collected for a fixed set of category prompts. It measures how often AI assistants include you when buyers ask about your category.
How many prompts do I need to track AI visibility?
Around 30 prompts, covering about 10 buying intents with three phrasing variants each, is a good start. What matters more is the total number of answers: aim for at least 200 per platform per month, or use a rolling three month average.
Why does ChatGPT give different answers to the same question?
AI assistants generate answers with some randomness and may search different sources each time. Research shows recommendation lists rarely repeat exactly, which is why you should measure mention frequency across many runs rather than single answers.
Should I track my position in AI answers?
Record it for reference, but do not report it as a ranking. Position changes from run to run, while how often you appear across many runs is a far more stable signal.
Can I use the API instead of the ChatGPT app to measure mentions?
You can, and it scales well, but API answers can differ from the consumer apps that add web search and their own instructions. Use the same method every month and check a sample against the real apps each quarter.
Need help measuring your AI visibility?
Need a number you can defend in the boardroom, not a screenshot of one ChatGPT answer? Request an AI visibility baseline and we will build the prompt set, sample it properly and show you where you stand.
Disclaimer: Brightdesk and all example figures are imaginary. Margins of error use the standard normal approximation and are a guide, not exact for very low mention rates. Study findings are summarised from the linked report. Client results come from work led by our founder and depend on market, product and execution.