The short answer: a Core Web Vitals audit measures how fast, responsive and stable a site feels to real users, finds the page templates that fail Google’s thresholds, and identifies the specific causes on each. Start with field data from real users in Search Console’s Core Web Vitals report and PageSpeed Insights, aiming for Largest Contentful Paint within 2.5 seconds, Interaction to Next Paint of 200 milliseconds or less and Cumulative Layout Shift of 0.1 or less at the 75th percentile of page loads, then use lab tools such as Chrome DevTools and Lighthouse to trace each failure to images, scripts, fonts or layout.
Core Web Vitals are easy to measure badly. Teams chase a single Lighthouse score on the homepage while the templates that earn revenue fail for real users on mobile. In the UAE, where mobile devices produce about 61% of web traffic (StatCounter) and connections are among the fastest in the world, a slow page is almost always the site’s own doing. This guide explains the metrics, which data to trust, how to audit each metric step by step, the issues that come up most on UAE sites, and includes a sample audit report.
What is a Core Web Vitals audit?
A Core Web Vitals audit is a template by template review of loading speed, responsiveness and visual stability using real user data, which identifies the pages that fail Google’s thresholds, the elements causing each failure, and a prioritised list of fixes.
It is narrower than a full speed review and much narrower than a full site review; for the wider picture, our guide to a website audit in Dubai covers speed alongside security, conversion and tracking.
What are the Core Web Vitals and their thresholds?
The Core Web Vitals are Largest Contentful Paint (LCP) for loading, Interaction to Next Paint (INP) for responsiveness and Cumulative Layout Shift (CLS) for visual stability, assessed at the 75th percentile of page loads, separately for mobile and desktop (web.dev).
| Metric | What it measures | Good | Poor |
|---|---|---|---|
| Largest Contentful Paint (LCP) | Time until the largest visible element, usually a hero image or headline, has loaded | 2.5 seconds or less | Over 4 seconds |
| Interaction to Next Paint (INP) | Delay between a tap, click or key press and the screen visibly responding | 200 milliseconds or less | Over 500 milliseconds |
| Cumulative Layout Shift (CLS) | How much visible content unexpectedly moves while the page loads | 0.1 or less | Over 0.25 |
INP replaced First Input Delay (FID) as a Core Web Vital on 12 March 2024 (Search Engine Land). Audits and tools that still report FID are out of date. Values between good and poor are rated as needing improvement.
How much do Core Web Vitals matter for SEO and revenue?
Google highly recommends achieving good Core Web Vitals for success with Search and says they align with what its core ranking systems seek to reward (Google Search Central), but they work alongside relevance and content quality rather than outweighing them; the bigger effect is often on conversion.
In a Deloitte study of 37 brand sites and over 30 million sessions published on web.dev, a 0.1 second improvement in mobile speed was associated with retail consumers spending 9.2% more, travel booking rates improving 10%, and 21.6% more lead generation users reaching the form submission page (web.dev). A Core Web Vitals audit should therefore prioritise the templates where people buy, book or enquire.
Should you trust field data or lab data in a Core Web Vitals audit?
Use field data, measured from real Chrome users, to decide what fails and how badly, and lab data, measured in a controlled test, to find out why; Search Console and PageSpeed Insights report field data from the Chrome UX Report, while Lighthouse measures LCP and CLS in the lab and uses Total Blocking Time instead of INP, because a lab test has no real user input (web.dev).
| Tool | Data type | Best use in the audit |
|---|---|---|
| Search Console Core Web Vitals report | Field, grouped by similar URLs | Find failing templates across the site |
| PageSpeed Insights | Field for the URL or origin, plus a lab run | Check a template’s real scores and see diagnostics |
| Chrome DevTools Performance panel | Lab, plus live INP on your own interactions | Trace exactly what blocks loading or interaction |
| Lighthouse | Lab | Quick diagnostics; not a substitute for field data |
| Real user monitoring in analytics | Field, your own visitors | Segment by country, device and template |
Step 1: How do you find which templates fail?
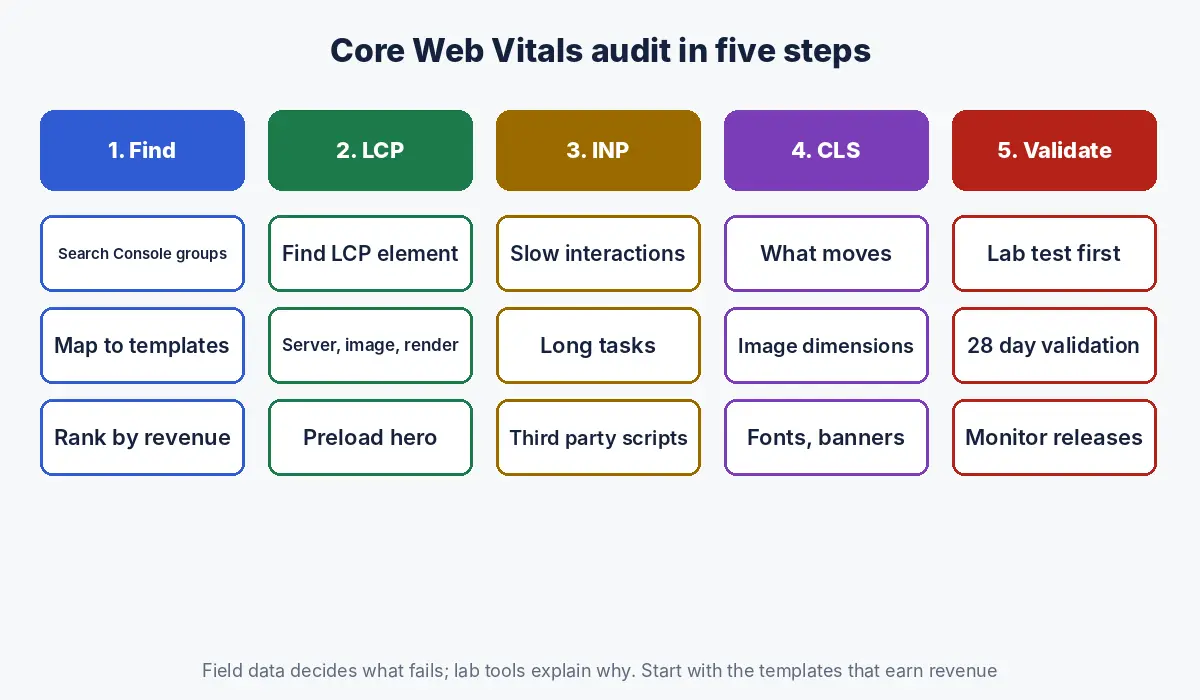
Open Search Console’s Core Web Vitals report for mobile and desktop, list the URL groups rated poor or needing improvement, and map each group to a page template; the report groups URLs with a similar experience, rates each group by its poorest metric, and omits URLs without enough data (Search Console Help).
- Export the failing groups for mobile first, since most UAE traffic is mobile.
- Map each group to a template: home, category, product, service, location, article, search, checkout.
- Rank templates by business value: traffic, conversions and revenue from analytics.
- Check one example URL per template in PageSpeed Insights to confirm the failing metric.
- For low traffic templates with no field data, use lab tests and real user monitoring instead.
Step 2: How do you diagnose a slow Largest Contentful Paint?
Diagnose LCP by identifying the LCP element on each failing template, usually a hero image, banner or headline, and measuring each phase: server response time, the delay before the resource starts loading, how long it takes to download, and the delay before it renders.
| Cause | How to spot it | Typical fix |
|---|---|---|
| Slow server response | High time to first byte in PageSpeed Insights or DevTools | Caching, CDN with regional edge locations, faster hosting |
| Large hero image | LCP element is an image over a few hundred kilobytes | Resize, compress, modern formats, responsive sizes |
| Image discovered late | Hero image loaded by script or CSS background | Put it in the HTML; preload it; never lazy load the LCP image |
| Render blocking CSS and scripts | Long gap before first render | Defer non critical scripts; inline critical CSS |
| Sliders and carousels | LCP element changes or loads late | Replace with a single static hero |
Step 3: How do you diagnose a poor Interaction to Next Paint?
Diagnose INP by finding which interactions are slow, such as opening menus, filtering, adding to cart or submitting forms, and tracing the JavaScript that runs on the main thread when they happen.
| Cause | How to spot it | Typical fix |
|---|---|---|
| Heavy third party scripts | Chat, reviews, tag managers and trackers in the Performance panel | Remove unused tags; load widgets on interaction |
| Long JavaScript tasks | Tasks over 50 milliseconds blocking the main thread | Break up work; defer non urgent code |
| Large page builder themes | Many scripts on every page | Lighter theme or template clean up |
| Expensive filters and search | Lag when filtering product or listing pages | Optimise the filter code; update results incrementally |
| Large DOM | Thousands of elements on category pages | Paginate or reduce elements per page |
Step 4: How do you diagnose Cumulative Layout Shift?
Diagnose CLS by recording the page load and identifying which elements move: usually images and embeds without set dimensions, banners or cookie notices inserted above content, late loading fonts, and ads or widgets that resize.
| Cause | Typical fix |
|---|---|
| Images and videos without width and height | Set dimensions or aspect ratio in HTML and CSS |
| Cookie or promotional banners pushing content down | Overlay them or reserve space |
| Web fonts swapping and resizing text | Preload fonts; use fallback fonts with matching metrics |
| Late loading reviews, chat or ad slots | Reserve fixed space for them |
| Content injected above existing content | Insert below the viewport or after user action |
What Core Web Vitals issues are common on UAE websites?
UAE sites most often fail on oversized hero images, Arabic web fonts, stacked third party widgets such as WhatsApp, chat, booking and reviews, and hosting without a regional CDN, problems made more visible because users expect speed on networks with median mobile downloads of 614.42 Mbps (DataReportal citing Ookla).
- Arabic fonts: full Arabic font families are large; subset them, limit weights and preload the one used above the fold.
- Widget stacking: a WhatsApp button, a chat widget, a booking tool and a review badge can each add scripts to every page; load them only where needed or on interaction.
- Bilingual templates: right to left versions sometimes load both stylesheets; check the Arabic templates separately.
- Hosting: servers far from the Gulf without a CDN add response time to every request.
- Device mix: Android runs on about 73% of mobile devices in the UAE (StatCounter), including many mid range phones; test on a mid range Android device, not only on the latest iPhone.
What does a sample Core Web Vitals audit report look like?
A sample Core Web Vitals audit report shows the status of each template on mobile and desktop, names the failing metric and its cause, and lists fixes with expected effect, owner and priority.
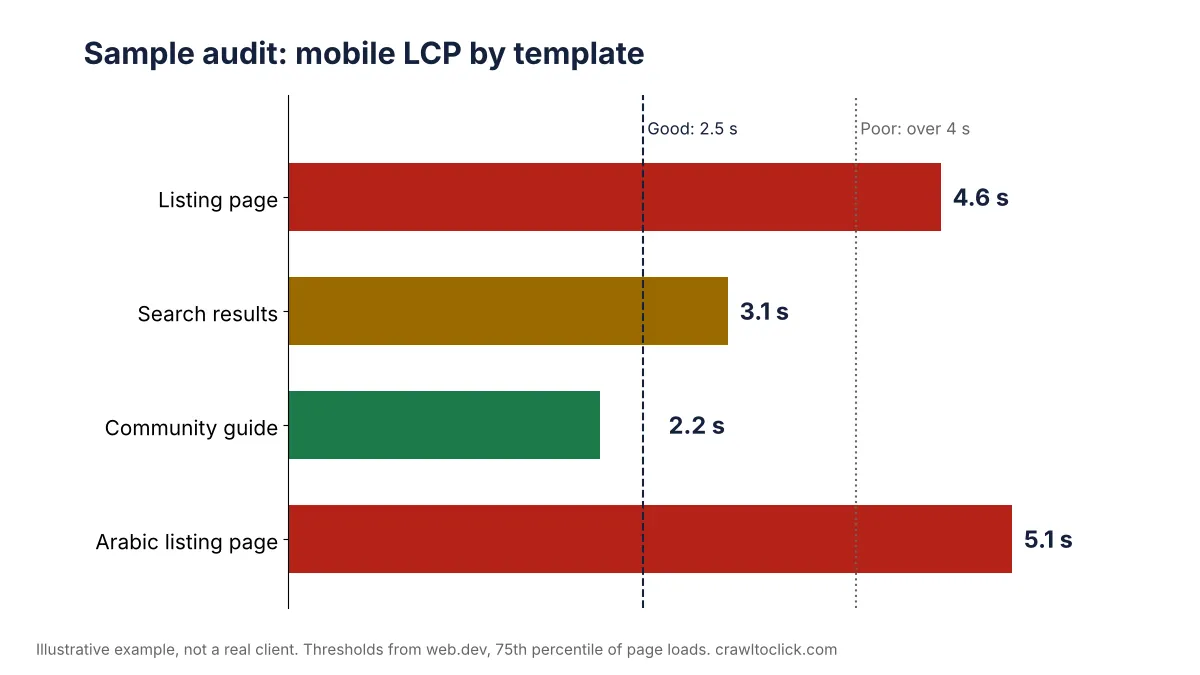
Sample summary (illustrative): “A Dubai property portal. On mobile, listing and search templates fail LCP and INP; article pages pass. The listing hero gallery loads 2.4 MB of images through a slider script, a chat widget and two tracking tags run on every page, and Arabic templates load a full font family with six weights. Fixing the gallery and deferring the chat widget should bring listing pages into the good range.”
| Template (mobile) | LCP | INP | CLS | Status |
|---|---|---|---|---|
| Listing page | 4.6 s | 380 ms | 0.05 | Poor |
| Search results | 3.1 s | 520 ms | 0.12 | Poor |
| Community guide | 2.2 s | 150 ms | 0.04 | Good |
| Arabic listing page | 5.1 s | 410 ms | 0.18 | Poor |
| # | Finding | Evidence | Impact | Fix | Owner | Priority |
|---|---|---|---|---|---|---|
| 1 | Hero gallery slider loads all images up front | DevTools: 2.4 MB of images before LCP | Slow LCP on the main revenue template | Static first image, preloaded; load the rest on swipe | Developer | High |
| 2 | Chat widget and two tags on every page | Performance panel: long tasks on interaction | Poor INP on listing and search | Load chat on click; remove unused tag | Developer, marketing | High, quick win |
| 3 | Search filters rerender the whole list | Slow response after each filter tap | Poor INP on search | Update results incrementally | Developer | Medium |
| 4 | Arabic font family with six weights | Network panel: 900 KB of font files | Slow LCP and layout shift on Arabic pages | Subset fonts; two weights; preload the main one | Developer | High, quick win |
| 5 | Cookie banner pushes content down | Recorded layout shift on search page | CLS needs improvement | Overlay banner instead of inserting it | Developer | Medium, quick win |
The portal and figures above are illustrative, not a real client. To write up your own findings in this format, use our free SEO audit report template.
How do you fix, validate and monitor Core Web Vitals?
Fix one template at a time, test the change in the lab, release it, then start validation in Search Console, which runs a 28 day monitoring session to confirm the issue no longer appears (Search Console Help); keep monitoring with real user data so new widgets and features do not undo the work.
- Fix the highest value failing template first.
- Confirm the improvement in Chrome DevTools and PageSpeed Insights lab data.
- Release, then click Validate fix in Search Console for the affected group.
- Watch field data over the following four weeks; field data lags behind releases.
- Add a performance check to the release process so new scripts are reviewed before going live.
For large sites, recurring checks can be scripted; our guide to Claude Code for SEO shows how to automate template level checks.
What are the common Core Web Vitals audit mistakes?
| Mistake | Better approach |
|---|---|
| Judging by one Lighthouse score | Use field data by template, then lab data to diagnose |
| Testing only the homepage | Audit the templates that earn revenue |
| Testing on a fast laptop | Test on a mid range Android phone on mobile data |
| Reporting FID | Use INP, the Core Web Vital since March 2024 |
| Lazy loading the hero image | Load the LCP image eagerly and preload it |
| Ignoring Arabic templates | Audit right to left versions separately |
| Fixing once and forgetting | Monitor field data and review new scripts before release |
How Crawl To Click runs Core Web Vitals audits
Crawl To Click is an SEO and AI visibility consultancy, and our Core Web Vitals audits start from revenue: we map Search Console’s failing URL groups to templates, rank them by traffic and conversions, confirm field data in PageSpeed Insights, trace each failing metric in Chrome DevTools on a mid range Android device, and hand developers a template by template list of causes and fixes. We audit ecommerce stores, property portals, clinics, schools, software companies and publishers in the UAE and India. For template specific issues in online stores, see our ecommerce SEO audit guide, and for where speed fits in a full audit, our guide to SEO audits in Dubai.
FAQs on Core Web Vitals audits
What are good Core Web Vitals scores?
Good Core Web Vitals are a Largest Contentful Paint of 2.5 seconds or less, an Interaction to Next Paint of 200 milliseconds or less and a Cumulative Layout Shift of 0.1 or less, measured at the 75th percentile of page loads for mobile and desktop separately.
Is INP part of Core Web Vitals?
Yes. Interaction to Next Paint replaced First Input Delay as a Core Web Vital on 12 March 2024. It measures how quickly a page visibly responds to taps, clicks and key presses.
Why do PageSpeed Insights and Search Console show different results?
PageSpeed Insights shows field data for a single URL or origin plus a lab test of that page, while Search Console groups similar URLs across the site using field data. Lab results also differ from field results because they use a simulated device and network.
Do Core Web Vitals affect Google rankings?
Google highly recommends good Core Web Vitals and says they align with what its core ranking systems reward, but relevance and content quality matter more. Their larger effect is often on conversion rates.
How long does it take for Core Web Vitals fixes to show in Search Console?
Search Console’s validation runs a 28 day monitoring session after you start it, and field data reflects real user visits over time, so improvements usually take several weeks to appear fully.
What tools do I need for a Core Web Vitals audit?
You need Search Console’s Core Web Vitals report to find failing templates, PageSpeed Insights to confirm field data for specific URLs, and Chrome DevTools or Lighthouse to diagnose causes, ideally tested on a mid range mobile device.
Stuck on Core Web Vitals your developers cannot fix?
Get a template by template diagnosis your developers can act on. Get a second pair of eyes on your Core Web Vitals.
Disclaimer: This article reflects Google and web.dev documentation as of the dates stated. The sample report is illustrative and does not describe a real business. Results depend on the site, platform and implementation.